Market Updates — Monthly Market Insight
2021 Market Updates
November 15, 2021
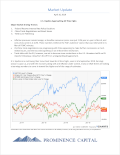
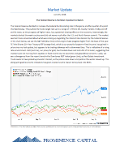
Record Inflation as Supply Chains are Under Significant Pressure
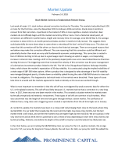
- Headline inflation was 6.2% in October, on a year-on-year basis, and core inflation wasn’t too far behind at 4.6%.
- Energy prices were a big part of the story with a 4.8% month-on-month gain and up 30% versus a year ago. Food prices have also been climbing steadily, and were 5.3% higher than a year ago, the fastest pace since early 2009...
Download »
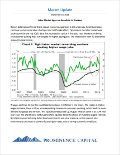
July 14, 2021
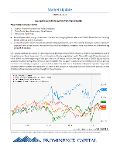
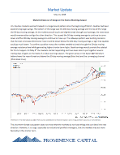
Inflation Measures Hit a Record
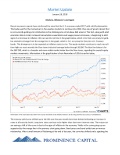
- The Producer Price Index for final demand increased 1.0 percent in June, as prices for final demand services rose 0.8 percent, and the index for final demand goods moved up 1.2 percent. The final demand index advanced 7.3 percent for the 12 months ended in June, the largest advance since 12-month data were first calculated in November 2010.
- Nearly 60 percent of the June advance in the final demand index, can be traced to a 0.8-percent increase in prices for final demand services. The index for final demand goods moved up 1.2 percent.... Download »
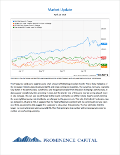
March 15, 2021
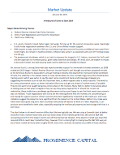
Massive Fiscal Stimulus Package Signed
- One year after the start of global lockdowns, it is starting to feel like the end is finally approaching. The new fiscal package signed into the law will continue to support a stronger economic recovery and the financial resilience of American households.
- The Consumer Price Index (CPI) came in on market expectations, while core CPI edged lower in February, giving inflation anxiety a short break...... Download »
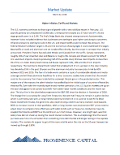
February 12, 2021
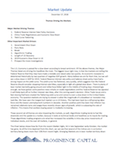
Is Inflation Coming?
- The headline Consumer Price Index rose 0.3% in January and was up 1.4% year-on-year. Removing food and energy prices, the core index was flat on the month and slowed to 1.4% year-on-year from 1.6% in December.
- Small business optimism deteriorated for the third month in a row in January. Underneath the headline, the employment indicators remained broadly positive. Initial jobless claims also edged lower to 793k last week...... Download »
January 11, 2021
Unprecedented....
- Unprecedented events rocked the U.S. Capitol last week. Ultimately, Congress certified Joe Biden as the next President and President Trump agreed to a peaceful transition of power.
- The Democrats took control of the Senate by prevailing in both Georgia runoff elections. With all three levels of government now in the hands of Democrats, President-elect Biden will have a better shot at implementing his agenda..... Download »
2020 Market Updates
October 15, 2020
Election and Taxes
- Fiscal policy (or lack thereof) drove much of the news cycle last week. On the same day the Federal Reserve Chair made the case for more fiscal support, President Trump tweeted that negotiations were being cut off.
- Trump changed his mind later in the week, and talks appear to have restarted. Still a deal will require the support of Senate Republicans, and with just over three weeks until the election, time is running out.... Download »
September 13, 2020
Coronavirus Impacting World Economic Activity
- After reaching new highs early last week, financial markets tumbled, driven by a broad sell-off in technology stocks.
- The labor market recovery continued, as the economy generated 1.4 million jobs in August, and the unemployment rate fell to 8.4%. However, the pace of the recovery has slowed from previous months, a theme that is echoed in other economic data..... Download »
August 14, 2020
Coronavirus Impacting World Economic Activity
- Despite a surge in COVID-19 cases in July, economic data remained broadly positive. Vehicles sales rose 11.3% to a better-than-expected 14.5 million (SAAR). The ISM indices also ticked up on the month and beat expectations.
- Importantly, the employment report confirmed that the jobs recovery continued in July, albeit at a slower pace. The U.S. added a better-than-expected 1.8 million jobs, while the unemployment rate fell to 10.2% from 11.1% in June.... Download »
February 20, 2020
China Phase One Deal. USMCA Deal Done and 2020 Outlook
- Risk sentiment turned positive this week, as investors took developments related to the Covid-19 virus and a mixed bag of U.S. data in stride. Among the data reports, the NFIB survey indicated that American small businesses entered 2020 on solid footing, with the confidence measure gaining additional ground in January.
- With a shortage of skilled workers and quality of labor concerns top of mind, small businesses continued to boost worker compensation in January, while signaling that they will continue to do so over the coming months as well. More wage pressures should put further upward pressure on inflation... Download »
January 20, 2020
New Highs Amid Turmoil
- The U.S. economy continued to churn out jobs at a solid pace. Non-farm employment grew by 1.6% over 2019, marking only a slight deceleration from the 1.7% recorded in 2018.
- The services side of the economy also continued to fare better than its manufacturing counterpart. The ISM Non-Manufacturing Index edged 1.1 points higher, to its highest level in seven months.
- The U.S. trade deficit dipped to its lowest level in three years, as tariffs, among other factors, shifted trade flows. Download »
2019 Market Updates
December 16, 2019
China Phase One Deal. USMCA Deal Done and 2020 Outlook
- The highly anticipated Phase One China trade deal has been agreed to, easing some trade tensions between the U.S. and China.
- The House of Representatives signed off on USMCA, which will replace NAFTA, for trade, between the U.S., Canada and Mexico.
- Impeachment does not seem to be impacting the markets and sentiment, at this time, and likely won’t, as an election year in 2020 will certainly be more front and center for investors and traders.
- American consumption remains healthy. While retail sales were soft in November, spending on services continues to be robust, leaving consumption tracking at 2-2.5% for the fourth quarter of 2019.
- The Conservative party won a majority in the UK election, paving the way for Brexit in January 2020. The next step of securing a trade deal with the EU will likely be more challenging. Download »
November 19, 2019
Markets Making All Time Highs
- U.S. data last week showcased the contrasting feature of the U.S. economy: a resilient U.S. consumer, but a struggling manufacturing sector.
- Negotiations on a phase one trade deal between the U.S. and China took a step back last week, as negotiators struggled, to come to a compromise. A deal is unlikely to be signed before the end of this month.
- Inflation remained subdued as the high dollar, inventory stockpiling and margin compression offset the price increases implied by tariffs. Download »
October 16, 2019
Yield Curve Inversion, Recession Signaling and China Trade Issues Front and Center of News Cycle
- China and the U.S. seem to have made some progress, toward a phased trade deal. However, China has shown some hesitancy after the announcement, suggesting much more needs to be done before the deal is papered.
- Impeachment is certainly a concern for many, although the markets have not sold off, in anticipation, of the coming outcome.
- CPI report- confirmed that inflation remained tame in September. Both headline and core inflation registered a muted 0.1% increase on the month, leaving the readings flat on a year-over-year basis.
- Meanwhile, the JOLTs survey showed that worker demand had softened over summer. The number of job openings fell in August on a year-on-year basis - a third drop in as many months.
- The pullback has some breadth across industries, with recent declines concentrated in retail trade, professional & business services, and accommodation & food services.
- Yield curve inversion and recession headlines are dominating today’s news headlines, but perspective is important. Download »
September 18, 2019
Something Else is Also Impacting Rates and the Yield Curve
- There was good news in the trade negotiations between the U.S. and China last week, as the President announced a postponement of tariffs, and China exempted key agricultural goods (pork and soybeans) from existing tariffs.
- The European Central Bank lowered its key policy rate further into negative territory this week, and announced a plan to restart asset purchases, that will continue “for as long as necessary” to bring inflation back to target.
- U.S. core inflation picked up in August and retail sales beat expectations. Even so, the Fed is likely to cut rates by 25 basis points when it meets next week, likely citing global growth and trade headwinds.
- US Equities markets are close to all time high levels again and oil prices spiked and then retreated over attacks in Saudi Arabia. Download »
August 16, 2019
Yield Curve Inversion, Recession Signaling and China Trade Issues Front and Center of News Cycle
- China responded to the threat of additional U.S. tariffs by halting agricultural purchases and allowing its currency to weaken beyond the psychologically important 7 yuan to the dollar level.
- Central banks around the world responded to the heightened risk posed by the spiraling trade war, by proactively cutting policy interest rates.
- The U.S. services sector showed signs of cooling in July, as the ISM non-manufacturing index declined to 53.7 from 55.1 from the previous month.
- Yield curve inversion and recession headlines are dominating today’s news headlines, but perspective is important. Download »
July 19, 2019
Still the Federal Reserve, Interest Rates, Earnings and China-U.S. Trade Driving Markets
Major Market Driving Theme: Federal Reserve Decisions and China Trade Negotiations
- In a busy week for Fed communication, Chair Powell gave his semiannual testimony to Congress where he confirmed that crosscurrents hitting the outlook would likely require some additional accommodation.
- The Fed Chair also noted that he doesn’t see the labor market as particularly hot and, with wage growth subdued, has more room to run.
- Powell also noted the risk that weak inflation could prove more persistent than anticipated. That risk diminished somewhat with the June CPI report, which showed core inflation firming across both goods and services. Download »
June 17, 2019
Federal Reserve, Interest Rates and China-U.S. Trade Driving Markets
Major Market Driving Theme: Federal Reserve Decisions and China Trade Negotiations
- A potential trade war between U.S. and Mexico was averted, but global trade uncertainty remains.
- Despite markets pricing in rate cuts, domestic indicators suggest that the U.S. economy is on decent footing.
Inflation remains stubbornly low, however.
- The Fed rate decision this week is clouded by conflicting signals, but we believe it will likely feature an easing bias. Download »
May 13, 2019
China-U.S. Trade Driving Markets
Major Market Driving Theme: China Trade Negotiations
- The U.S. increased tariffs to 25% on $200bn worth of Chinese imports. The threat to extend a 25% tariff to virtually all Chinese imports “shortly” remains. This comes even as the two sides continue negotiations to reach a trade deal.
- China announced its own tariffs on U.S. imports of 25% on roughly $60 billion worth of U.S. goods starting June 1, 2019
- The U.S. overall trade deficit edged higher in March to $50bn, even as the bilateral goods trade deficit with China declined to a five-year low.
- Consumer price inflation continues to show little signs of accelerating, with both headline and core inflation around 2%. Things could change however, as tariff hikes filter through the economy.... Download »
April 22, 2019
U.S. Equities Approaching All Time Highs
Major Market Driving Themes
- Federal Reserve Interest Rate Policy Decisions
- China-Trade Negotiations and Brexit Issues
- Yield Curve Flattening
- Inflation pressures remain benign, as headline consumer prices rose just 1.9% year-on-year in March, and core prices came in at 2.0%. These numbers reinforce the Fed’s ‘patience’ stance that was reiterated in its March FOMC minutes... Download »
March 15, 2019
U.S. Equities are Still Recovering from Year End 2018
Major Market Driving Themes
- Federal Reserve Interest Rate Policy Decisions
- China-Trade Negotiations and Brexit Issues
- Yield Curve Flattening
- Recently we saw housing data come in that was encouraging. Home sales rose 3.6% in December and... Download »
January 25, 2019
A Rebound of Sorts to Start 2019
Major Market Driving Themes
- Federal Reserve Interest Rate Policy Decisions
- China-Trade Negotiations and Economic Slow Down
- Yield Curve Flattening
- U.S. equity markets moved higher again last week, firming up for the second...
Download »
2018 Market Updates
December 28, 2018
Themes Driving the Markets
The U.S. Economy is poised for a slow down according to broad sentiment. Of the above themes, the Major Themes listed are driving the headlines the most.
The biggest issue right now, is that the markets are telling the Federal Reserve that they may have made a mistake and raised rates too quickly... Download »
November 27, 2018
After the Mid-Term Elections, Focus Shifts to China Trade Negotiations and Interest Rates
Between the midterm elections and a Fed rate decision, there was plenty of news last week. But, after the dust settled, there was very little new information.
In the midterm elections, Democrats gained a majority in the House of Representatives and Republicans tightened their grip on the Senate... Download »
October 17, 2018
Equities Pull Back After Making New All Time Highs
U.S. equities markets hit new all-time highs late in September, bucking a trend that historically September is one of the worst months for the U.S. stock markets.
The markets remained close to their all-time high through the close of October 3rd... Download »
September 19, 2018
Labor Market Signs are Beneficial to Workers
Recent data has confirmed that a robust economic expansion is still underway. Small businesses continue to impress as labor shortages and tariffs take effect.
Tightness in the labor market was underscored by the July JOLTs data that recorded an... Download »
August 15, 2018
Turkey’s Economic Crisis Is Now the Focus
Global equity markets were hit Friday by fears that Turkey’s deepening economic crisis will spread. The Turkish lira plummeted as investors have lost confidence that the Erdogan regime will be able to steer Turkey through its current crisis.
We're seeing follow through fear grip markets this week, however it begs the question... Download »
July 20, 2018
Chinese Tariffs and Feds Upbeat View of Economy
Since last market update, action on Chinese import tariffs has dominated the economic news, but markets remained positive overall, likely reflecting relief that oil prices have come off their recent highs.
Since China retaliated to the first salvo of U.S. tariffs, the U.S. is moving ahead... Download »
June 15, 2018
The Federal Reserve is the Most Important to Watch
The Federal Reserve decided to increase the Federal Funds lending rate it charges by another quarter of a point this Wednesday. This pushed the funds target rate up to a range of 1.75% to 2%. Equity markets mildly sold off on this news, as the prospects of higher rates, has a potential slowing effect on the economy... Download »
May 15, 2018
Markets Break out of Range on the Heels of Earnings Season
U.S. Equities markets seemed trapped in a range bound pattern since the beginning of March. Equities had been experiencing large swings. The bottom of the range was the 200-day moving average and the top of the range the 50-day moving average. As the markets would touch and slightly break through each average, the next move... Download »
April 24, 2018
Tariff and Trade War Tension Ease a Bit and Earnings Season Arrives
Tariff and trade war tensions eased a bit with China coming out and extending two olive branches to the Trump administration. The first olive branch was President Xi Jinping working to further facilitate pressure on North Korea to sit and have talks with the U.S. on denuclearization. Then, President Xi Jinping announced that China... Download »
March 15, 2018
Higher Inflation, Tariffs and Markets
The U.S. economy continues to show signs of growth with a very solid job report in February. U.S. payrolls grew by an unexpected 313,000 jobs. Unemployment stayed at a 17 year low of 4.1% and wage growth came in at 2.6%. The Fed’s Beige Book also showed strong economic fundamentals, however it also included evidence that businesses... Download »
February 16, 2018
Stock Market Corrects as Fundamentals Remain Strong
Last week all major U.S. stock indices entered correction territory by Thursday. The markets had pulled back 10% or more for the first time, since the November 2015 to February 2016 correction. Stocks took 4 months to recover from that correction. A pull back in the market of 10% or more signifies a market correction... Download »
January 18, 2018
Markets, Milestones and Apple
Recent economic reports have reinforced the view that the U.S. economy ended 2017 with solid fundamentals. This bodes well for the momentum in the equities markets to continue into 2018. One area of great interest that is not currently getting a lot of attention is the climbing price of oil above $60 a barrel... Download »
2017 Market Updates
December 13, 2017
Tax Plan, Bitcoin and the Economy
While many on Wall Street and Main Street seem focused on what is going to happen with the new tax plan and the incredible rise of Bitcoin, the economy has continued to show signs of strength. The Federal Reserve will meet this week. There is an expectation that they will raise short term interest rates... Download »
November 15, 2017
Waiting for the Tax Plan
Earnings season has mostly come and gone at this point, and it was a good reporting season. The markets have started to show a little bit of softness, as we are waiting to see the new tax plan get finalized. It is difficult to speculate on exactly what the final version will look like, at this time. Download »
October 11, 2017
Distorted Economic Data After Hurricanes
U.S. economic data has been impacted by hurricanes and may continue to see volatility with the raging wild fires impacting California. Hurricanes impacted auto sales, ISM indices, trade and payroll data. Auto sales increased as consumers affected by the storms replaced flood-damaged vehicles. ISM indices (manufacturing) surged.... Download »
September 14, 2017
Economic Data Volatility Ahead After Hurricanes Harvey and Irma
The U.S. equities markets were in rally mode on the first trading day after Hurricane Irma made landfall in Florida. Partly, because the effects of the hurricane ended up being not as disastrous as predicted. One thing to remember is that not all the effects of this hurricane have come to bare just yet. Download »
August 17, 2017
Return of Volatility
Since last month’s market update, the markets have been driven by corporate earnings and political events. The tensions between the U.S. and North Korea escalated and started to weigh on the markets at the end of last week. Market volatility jumped with the VIX rising sharply. The world unanimously voted for sanctions against the North Koreans which included votes from China and Russia. Download »
July 14, 2017
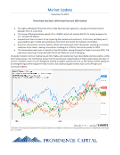
Equity Markets Continue to New All Time Highs
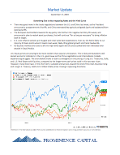
U.S. equity markets continue hitting new all-time highs today. Since the beginning of this year the S&P 500 is up 8.42% and up 14.41% since the election as of the close of trading on July 13, 2017. The blue line in the graph below indicates the S&P 500. Bond prices are down 2.96% for the year and 5.31% since the election as indicated by the orange line in the chart below, which is for TLT a proxy for long term bonds. Download »
June 12, 2017
Equity Markets Continue to New All Time Highs
U.S. equity markets are hitting new all-time highs today. This week the financial sector of the market has been leading the way. The group is posting its best returns since late April. Historically, when financials lead the way, it is often considered very positive for the markets over all. An economy cannot run and markets often cannot do well without the financials as part of the leadership group. Download »
May 11, 2017
Distraction and Shifting Rationale
April's political distractions were centered around the pressing issues of what to do in Syria, the Middle East, North Korea and Russia. We are now focused on the firing of FBI Director James Comey as both political parties conveniently forget their past praises and criticisms of the man. Both sides seem interested in using the current Comey event to generate leverage politically to push forward their agenda. Download »
April 12, 2017
Geo-Politics and the Markets
It is incredible what a month of changing geo-political issues can do. Since my last market update, the U.S. has changed its stance on conflicts in the Middle East, Russia and has gotten significantly more aggressive with its intentions toward North Korea. While this has unfolded, the U.S. has held very high level talks with world leaders... Download »
March 15, 2017
The Path to Normalization
Today, as I write this market update, Janet Yellen, The Federal Reserve Chair Woman is discussing this morning’s Federal Reserve decision to increase the Federal Funds rate by 0.25%. The Federal Reserve is making it’s interest rate policy decisions based on an evaluation of economic conditions and is not on a preset course... Download »
February 16, 2017
Markets, Federal Reserve Comments and the Fiduciary Rule
The Ten Year Treasury rate is hovering around 2.5% currently. The TLT, a proxy for long term U.S. Treasury bonds, has traded down a bit since last month's update. It has however, been a bit range bound in trading, indicating that long term prices for bonds are somewhat stable at this time... Download »
January 12, 2017
Are Bond Prices Stabilizing As DOW Nears 20,000?
On December 15 2016, the Ten Year Treasury rate hit a recent peak of 2.61%. The TLT, a proxy for long term U.S. Treasury bonds, hit its recent price low of $116.80 one day earlier on December 14 2016. The importance of this is that bond yields move inversely to bond prices. This indicates that around the middle of December shortly after the Federal Reserve... Download »
2016 Market Updates
December 12, 2016
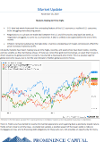
Year End Rally in Equities, Bonds Sell Off
Since last month’s Market Update, the equity markets have continued to gain ground and rally. Bond prices are still under pressure but have shown some signs of stabilizing, since the immediate sell off post-election. (Last month’s Market Update is here.) The chart below starts on November 8th and goes through the end of the trading day December 8th, exactly one month since the election. The S&P 500 (blue line) is up 4.98% in this time frame, while the price of TLT (orange line), a proxy for long term U.S. Treasury bonds, is down 8.54%.... Download »
November 10, 2016
Trump Presidency and Your Money
Just a month ago it seemed that Hillary Clinton had a significant if not insurmountable advantage over Donald Trump to become president. As things have now played out, Donald Trump is our New President Elect. On November 8th as the votes were coming in the Dow and S&P 500 futures markets had been indicating a severe market correction and the Bond futures where signaling an increase in Bond prices and lowering of yields.... Download »
October 13, 2016
Markets and the Election
Since my last Market update on September 13, the markets have not regained upward momentum. Many are calling for a further near term 5 to 10% move down from where we are today. The market broke below the 50 day moving average on the S&P 500 on September 9th, which was the day that we saw the markets first 1% downward move since Brexit in June. Since then, we have seen the S&P 500 move between 2120 and 2180. The 50 day moving average is around 2165 while the 200 day is around 2068. Until the S&P can break above the 50 day moving average and stay there for a few days, I see this market staying range bound at best and testing the resistance level of 2120.... Download »
September 13, 2016
Fed, Fed, Fed!
On Friday September 9th, the S&P 500 had its first decline of 1% in a day, since June of this year when Britain voted to leave the EU. The main reason was fears of a Federal Reserve rate hike. On Monday, the next trading day, the markets rebounded a bit on somewhat bullish comments from one of the Federal Reserve committee members. Overnight however international markets got a bit spooked because of potential Federal Reserve interest rate increases and today we are continuing the markets downward trend. The S&P 500 has broken through its 50 day moving average (blue line in graph below) which is a short term trend in the markets that acts as a resistance and support level. It is important to remember that it has been roughly 51 sessions since Britain left the EU, where we had a trading day that saw more than a 1% decline... Download »
August 10, 2016
What made the markets move and what will drive it going forward?
The S&P 500 as of the close on August 9th has gone up roughly 30 more points since last month's market update. The yield on 10yr. Treasuries has been somewhat range bound between 1.5 to 1.6 percent. Many traders are concerned that the S&P 500 has moved a bit too far too fast, as stocks in the S&P 500 are trading close to 18x forward price/earnings valuations. The concern is not that there is a looming drastic down turn coming in the markets, but rather, when the next pull back toward the short term 50 day moving average on the S&P 500 will begin. Traders are looking for buying opportunities as the recent run up in stock prices is feeling a little bit tired... Download »
July 13, 2016
New All Time Highs For The S&P and Dow.
Earlier this week, the S&P 500 and the Dow Jones Industrial Averages broke through all time highs. Since my last market update, the U.S. markets have shrugged off Britain leaving the European Union and a subsequent global sell off to quickly rebound and make new all time highs... Download »
June 10, 2016
Presidential Race, Brexit, Unemployment, Federal Reserve Policy.
In the last month, the top news stories have all surrounded the Presidential race. This is certainly going to have an effect on markets, but there are a few other major developments that have been front and center for the investment markets as well. Many investors are watching what is going on with Britain's possibility of leaving the European Union dubbed Brexit. Also, the most recent poorer than expected unemployment numbers have had an effect due to the anticipation of how the Federal Reserve will shape it's policy decisions... Download »
May 4, 2016
Is this market rebound getting tired or just pausing before it continues toward a new
bull market?
Since last month's Market update the S&P 500 hit a new year to date high of 2,111.05 on April 20th and then pulled back from that high. This has led to many questions regarding whether or not the markets are poised to roll over and go back down or is it just a meaningful pause before we continue to move on toward a new bull market... Download »
April 5, 2016
Is this market rebound going to last?
On March 11th the markets broke through the 200 day moving average of prices for a brief time, until regaining and breaking through the 200 day moving average again on March 16th. Since then the markets have continued to show strength and have risen to a recent high on the S&P 500 of approximately 2075 on April 1st. The two year chart of the S&P 500 below shows the index crossing the 200 day moving average indicated by the orange line. Also of note: the trend of the shorter 50 day moving average is now sloping up indicated by the blue line... Download »
March 9, 2016
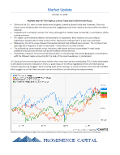
Is this market rebound going to last?
On February 11th the markets tested the most recent lows established and created a double bottom pattern, when charting the returns in the market. Since then, the markets have rebounded near term in a very strong manner breaking through short tern resistance and the 50 day moving average of prices on the major indices. All are technical indications that set up a positive market outlook in the near term and potentially in the longer term. The two year chart of the S&P 500 below shows the green arrow pointing to the double bottom formation. The blue line is the shorter term 50 day moving average of prices and the orange line is the longer term 200 day moving average of prices... Download »
February 10, 2016
Is this Bear Market for real and how long will it last?
In my last market update dated January 7, 2016, I discussed 2 main factors affecting the markets, China and Oil. I stated that I believed a short term Bear Market had begun. My overall stance on how to adjust portfolio's was to not do much at all, if anything, other than rebalance portfolios back to the strategic asset allocation being employed. For those wary of the immediate market environment I suggested to potentially consider looking at the most risky portions of their portfolios as a place to raise a small amount of cash. (If you would like a copy of the Market Update from January 7, 2016 please contact me.)... Download »
January 7, 2016
CHINA, CHINA, CHINA
2016 has started with market selloffs around the world. Why? The overwhelming reason is current issues in Chinese markets and economics. We all understand that to some degree all investment markets are global in nature. Recently, even the most local of all markets (Residential Real Estate) has benefited from globalized markets. For instance, many reports on local Real Estate values point to an influx of foreign capital chasing safer investments in real estate in and around the Los Angeles area. The reason for this is the stability of the economic environment in America and the strength of the U.S. Dollar... Download »